You are here
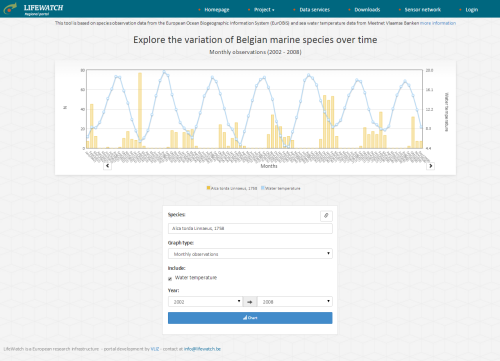
Explore the variation of Belgian marine species over time
url: https://www.lifewatch.be//eurobis-charts
This dynamic tool generates graphs illustrating the monthly, seasonal and yearly variation in species occurrences within the Belgian part of the North Sea. It uses species observation data from the European Ocean Biodiversity Information System (EurOBIS) and sea water temperature data from Meetnet Vlaamse Banken.
Link with LifeWatch Species Information Backbone:
This tool was developed in the framework of LifeWatch, as part of the internship of Jens Debergh during his bachelor training at Hogeschool West-Vlaanderen.